Training load and readiness
Both pages open from the cards at the top of Workouts. They are part of Plus; on Free each page is a locked summary with an Upgrade to Plus button.
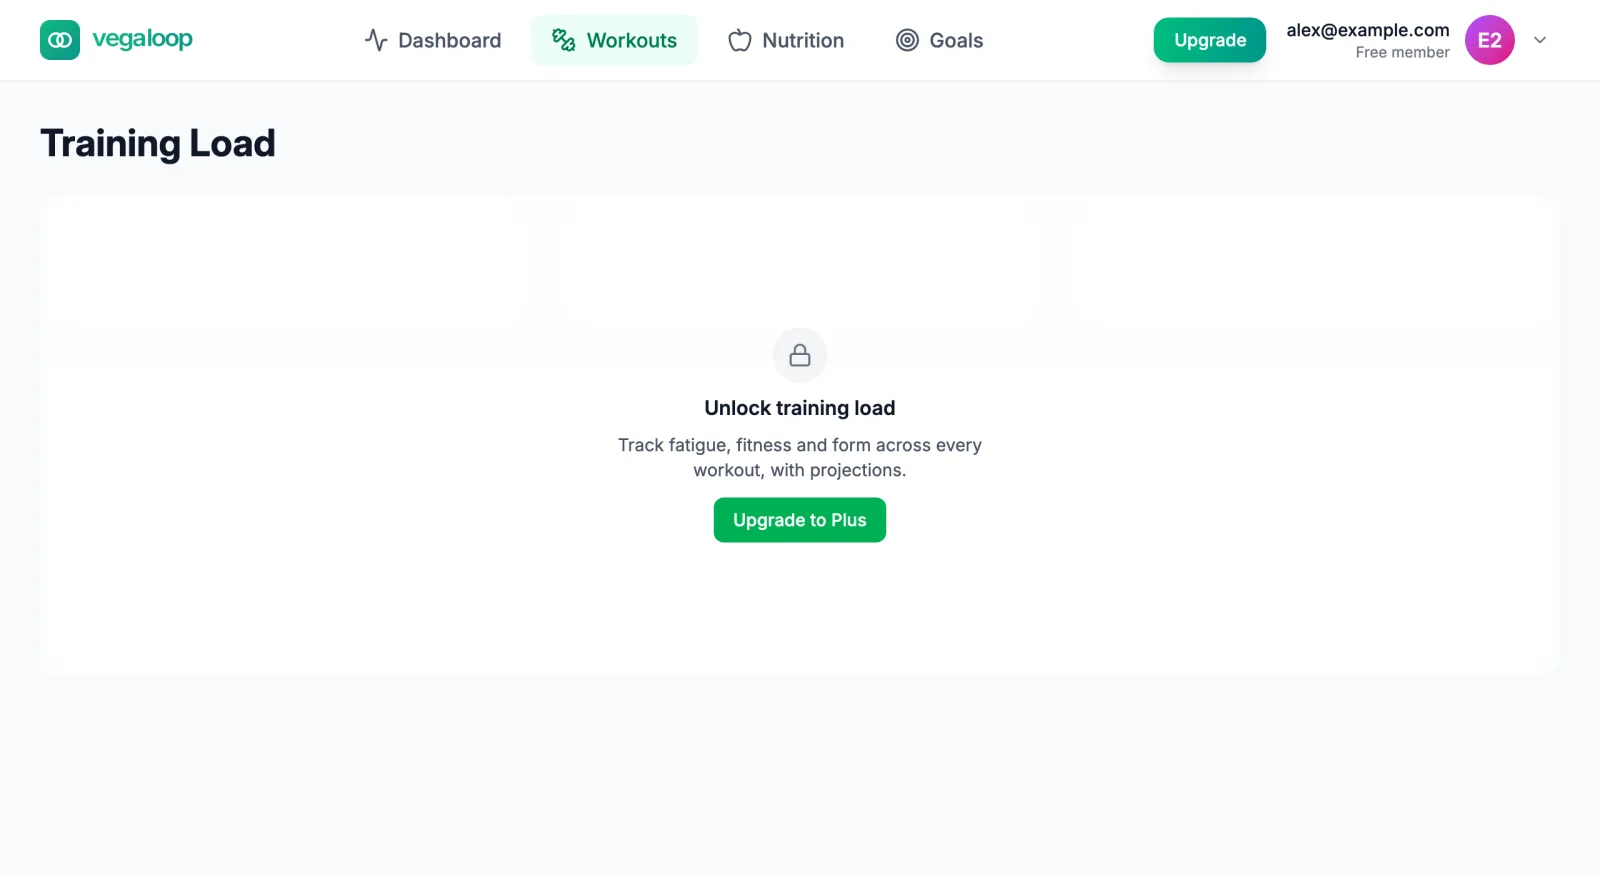

Training Load
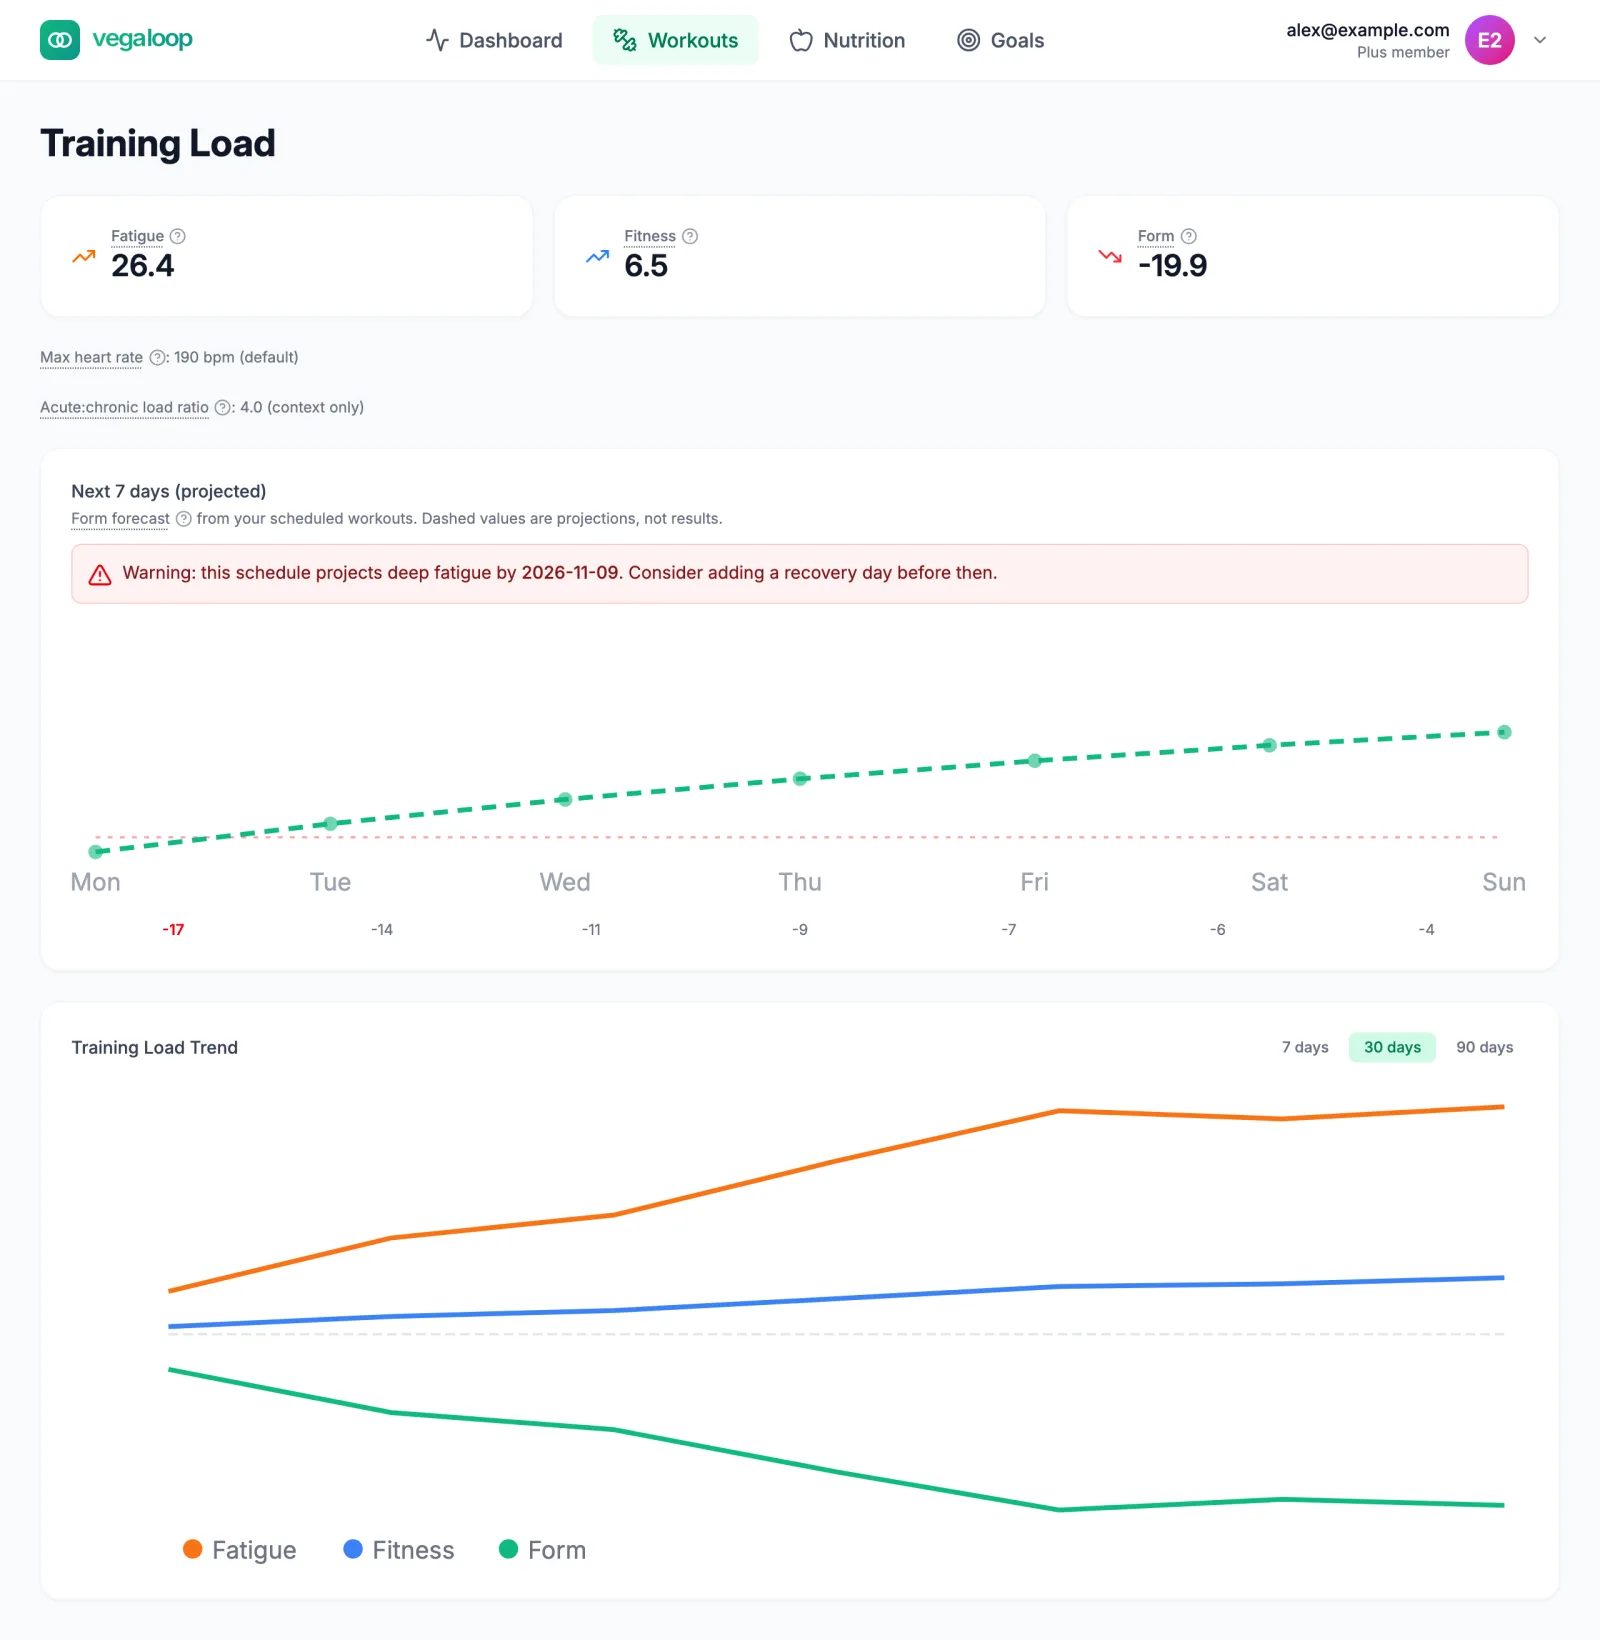
Load points
Every workout earns load points from how long and how hard it was. Where the measure comes from depends on the session:
| Session | Intensity from |
|---|---|
| Running or swimming | Pace against your threshold pace |
| Cycling | Power against your threshold power |
| Strength | Volume lifted |
| Anything with heart rate | Heart rate against your max and threshold |
| Anything else | Your perceived effort rating |
Days with no workout score zero, which is how rest lowers fatigue.
Fatigue, fitness, and form
| Number | What it tracks |
|---|---|
| Fatigue | A weighted average of load over roughly the last 7 days. Rises and falls quickly. |
| Fitness | A weighted average over roughly the last 42 days. Rises and falls slowly. |
| Form | Fitness minus fatigue. Positive means fresh; negative means carrying fatigue. |
Two lines under the numbers give context. Max heart rate is what turns heart rate into intensity; the default is an estimate, and a value set on your profile takes precedence. Acute:chronic load ratio compares the last week with the last month and is shown for context only.
Projection and trend
Next 7 days (projected) forecasts form from the sessions on your calendar. Dashed values are projections. A warning names the date when the schedule would push you into deep fatigue, so you can place a recovery day before it.
Training Load Trend plots the three lines over 7, 30, or 90 days. Until you have a few workouts the page reads Building your training baseline; a period with nothing in it reads No training data for this period yet.
Training Readiness
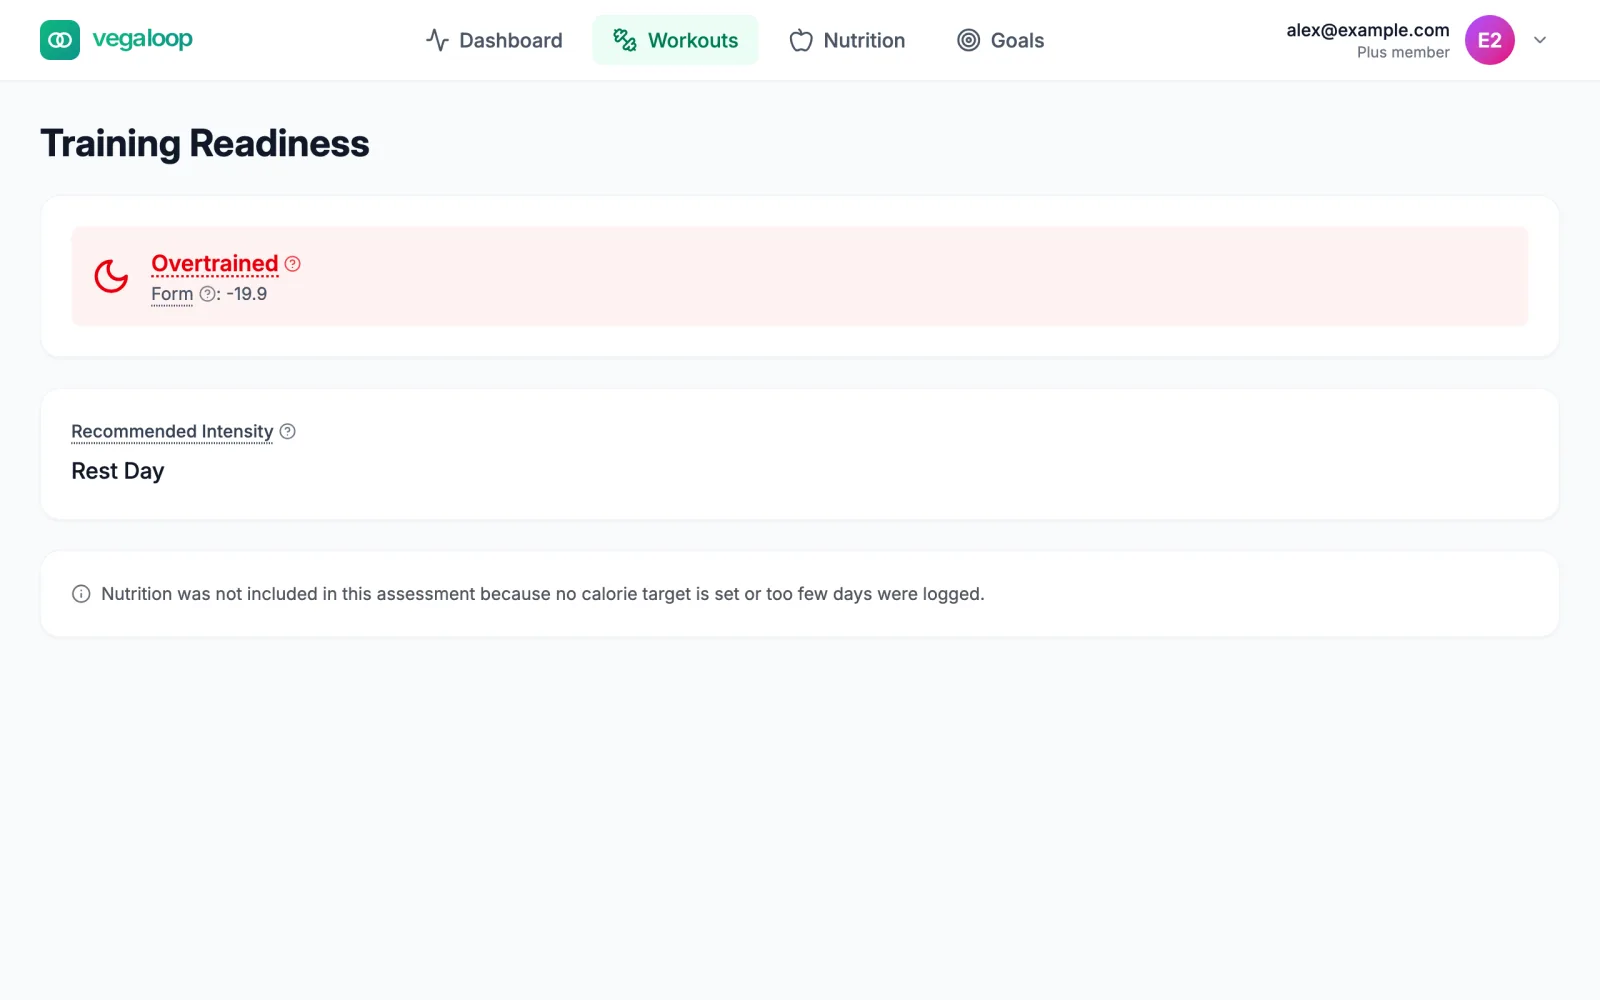
The level comes straight from form:
| Form | Level | Recommended intensity |
|---|---|---|
| Above 15 | Fresh | High |
| 5 to 15 | Ready | High |
| Minus 5 to 5 | Neutral | Moderate |
| Minus 15 to minus 5 | Fatigued | Low / Recovery |
| Below minus 15 | Overtrained | Rest Day |
Two adjustments can lower the recommendation by one step each, and they stack:
- Volume Warning. If this week’s load is more than 10 percent above last week’s, a High recommendation becomes Moderate. The warning shows the percentage and links to the 10 percent rule.
- Nutrition. If your average intake over the last 3 days is more than 20 percent below your calorie target, the recommendation drops one level and the page says why. With no calorie target or fewer than 3 logged days, the page notes that nutrition was not included.
With fewer than 7 days of history the page reads Still building your baseline instead of a level.
What to do with it
- Form a little negative during a training block is expected. Deeply negative form for several days in a row means you should rest.
- Before an event, plan easier days so form turns positive while fitness is still high.
- The forecast uses the sessions on your calendar, so its warning is accurate only if the planned sessions are realistic.
- If readiness is low but you feel fine, check your max heart rate and look for duplicate workouts; see Readiness looks too low in the first week.
See Understand your readiness for how to read the levels day to day, and Insights and suggestions for what the dashboard does with them.